But school vending earnings vary far more than most people expect. A machine at a community college near a student union performs nothing like a machine in an elementary school hallway — and projecting annual revenue without accounting for summer break is one of the most common (and costly) mistakes new operators make.
This article covers realistic earnings ranges for school vending machines, the cost structure behind those numbers, what separates high-performing school placements from break-even ones, and where smart technology decisions change the math.
Key Takeaways
- School vending machines typically gross $150–$500/month — net profit runs lower once you subtract commissions, restocking, and service costs
- K-12 machines only operate ~180 days per year — annual projections must account for summer and holiday breaks
- USDA Smart Snacks rules restrict K-12 machines during school hours, cutting out most high-margin snacks and beverages
- Colleges and universities consistently outperform K-12 on revenue, product flexibility, and operating hours — but exclusive contracts make independent placement harder
- Students rarely carry cash — machines without cashless payment miss a significant share of transactions
How Much Do School Vending Machines Make?
School vending revenue doesn't follow a fixed formula. Two machines placed in the same district can produce wildly different results depending on school size, building placement, product mix, and whether the machine is even allowed to operate during peak hours.
Typical Earnings Ranges
Public school district data gives a clearer picture than vendor blog estimates. Broward County Public Schools' Healthy Vending Program reported districtwide vending sales of approximately $185,000 at elementary schools, $260,000 at middle schools, and $925,000 at high schools for FY 2017–2018, across multiple machines per school type.
For a single machine, realistic monthly gross ranges by setting:
| Setting | Estimated Monthly Gross |
|---|---|
| Low-performing (restricted product, low traffic) | $75–$150 |
| Average K-12 hallway or cafeteria | $150–$300 |
| Large high school or community college | $300–$500+ |
These are gross figures before any deductions. Commission rates in Broward's public documents ranged from 5% to 30%+ depending on vendor and school level — so net revenue after paying the school, covering product costs, and factoring in service time is considerably lower.
Seasonal Earnings — The Number Most Projections Get Wrong
Pew Research cites NCES data showing 180 days as the most common K-12 school year requirement. That's roughly 9 months of operation, not 12.
A simple illustration: if your machine averages $250/month during active school months, you might project $3,000 annually by multiplying by 12. The adjusted figure — accounting for summer break, winter break, and spring break — is closer to $2,000–$2,250.
That's a 25–33% gap. For multi-machine operators, this miscalculation compounds quickly.
Colleges are different. Universities operate longer academic calendars, host summer sessions, and maintain year-round staff populations. Missouri State University's 2020 internal audit reported $302,323 in gross vending sales across 49 machines in calendar year 2019 — a campus with consistent 12-month activity.
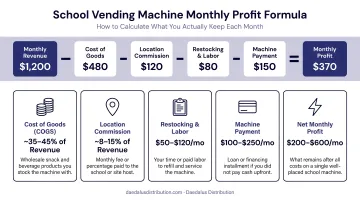
The Profit Formula for School Vending
A mid-range K-12 placement breaks down like this:
- Monthly gross sales: $250
- Subtract product costs (~50% of gross): −$125
- Subtract school commission (15% of gross): −$37.50
- Subtract restocking and service labor: −$30–$50
- Estimated net monthly profit: ~$37–$57
Push the gross to $400 (larger school, better placement) and cut commission to 10%, and net climbs to $110–$130/month. Commission rates in public RFP documents range from 2% to 36% depending on school level — that spread alone can make or break a placement's profitability.
Key Factors That Affect School Vending Earnings
Two machines in the same school district can produce results that look nothing alike. Earnings are driven by a combination of four factors: placement, product policy, contract terms, and technology.
School Type and Enrollment Size
The daily buyer pool determines transaction volume — and it varies dramatically by institution:
- Elementary schools often prohibit vending machines entirely or have very limited access
- Middle schools have restricted products and shorter accessible hours
- High schools offer larger student populations and more flexibility
- Community colleges and universities provide the most consistent, unrestricted customer base
A high school with 2,000 students generates more potential daily transactions than a middle school with 600. Size compounds every other variable.
Placement Within the Building
Being in the school isn't enough — where you are inside the building determines whether the machine gets traffic or collects dust. High-performing locations:
- Near gym exits or athletic facilities
- At cafeteria entrances (but not inside the cafeteria during meal periods)
- Main student gathering areas or common spaces
- Faculty break rooms (more on this below)
Low-performing locations: faculty-only wings, administrative corridors, remote hallways with minimal student foot traffic.
Worth noting: the teacher's lounge or staff break room is often the most consistent revenue spot in any K-12 building. Faculty use it daily, year-round including non-student days, and it's not subject to the same Smart Snacks product restrictions that apply to student-facing machines.
Product Restrictions and Compliance
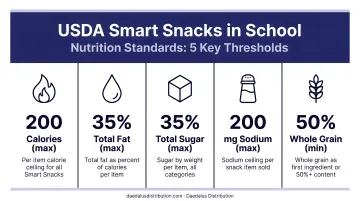
USDA Smart Snacks in School standards apply to all competitive foods — including vending machines — sold to students during the school day. The school day is defined as midnight before through 30 minutes after the school day ends.
Key product thresholds for snacks under Smart Snacks:
- 200 calories or less per item
- 200 mg sodium or less
- 35% or less of calories from total fat
- 0 g trans fat
- 35% or less sugar by weight
This eliminates most standard candy bars, full-sugar sodas, and many popular chip varieties — typically the highest-margin vending items. A CDC study of Appalachian Virginia middle schools found that only 36.6% of available snack foods met full Smart Snacks standards before implementation.
Colleges and universities are not subject to Smart Snacks rules. That single difference expands product selection significantly and changes the revenue ceiling for college placements.
Commission and Contract Structure
Commission structures vary more than most operators anticipate. Broward County's public procurement data showed commission rates ranging from 5% at elementary schools to 26–30% at high schools, depending on the vendor. Missouri State's college contract used a flat 22% of gross sales.
Common structures:
- Percentage of gross sales (most common in public school RFPs)
- Fixed monthly fee paid to the school
- Free placement — no commission, machine treated as a service
A 10% commission vs. a 30% commission on a $300/month gross machine is the difference between $270 and $210 in revenue before other costs. Negotiate contract terms carefully before signing.
One more consideration before you sign: universities often have exclusive national contracts with Canteen, Aramark, or Coca-Cola that make independent placement difficult or impossible. Large high schools and community colleges are generally more accessible for independent operators.
Machine Type and Payment Technology
Cash-only machines underperform in school settings because students don't carry cash. The Federal Reserve's 2025 Diary of Consumer Payment Choice found that adults 18–24 used mobile phones for 45% of all payments in 2024, and cash represented just 14% of all transactions across age groups.
Cantaloupe's 2024 data showed average cashless vending ticket size at $2.24 versus $1.78 for cash — a $0.46 gap that compounds quickly across hundreds of monthly transactions.
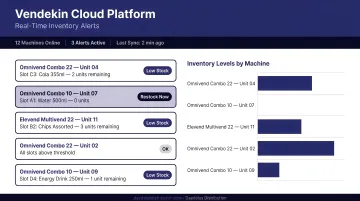
Remote inventory tracking solves a different operational challenge entirely: school vending demand is irregular. Usage spikes during exam periods and back-to-school weeks, then drops to near zero during breaks. Operators on fixed restock schedules either overstock machines before breaks or find them empty during peak periods.
Daedalus Distribution's Vendekin-powered machines — the Omnivend Combo 22, Omnivend Combo 10, and Elevend Multivend 22 — address both issues directly. All three include cashless payment (credit/debit, Apple Pay, Google Pay, and tap-to-pay), IoT-connected remote inventory monitoring, and real-time sales data through the Vendekin cloud platform.
The Omnivend Combo 10 is sized for school hallways and smaller campus locations. The 22-inch touchscreen models handle higher-volume placements at large high schools and universities.
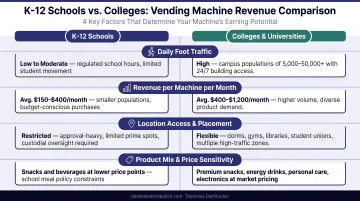
K-12 Schools vs. Colleges — Where Do Machines Earn More?
The right placement depends on the environment. Here's how K-12 and higher education compare across the factors that drive revenue:
| Factor | K-12 Schools | Colleges/Universities |
|---|---|---|
| Product restrictions | USDA Smart Snacks apply | No federal restrictions |
| Operating hours | Limited school-day hours | Often 24/7 in residence halls |
| Revenue potential | Moderate, seasonal | Higher, more consistent |
| Independent access | More accessible | Often blocked by exclusive contracts |
The revenue data supports colleges as the stronger performer. Missouri State's 49-machine campus generated an average of roughly $515/machine per month in gross sales — above the typical K-12 range — a campus-wide average that includes low-traffic academic buildings.
For most independent operators, the placement tier looks like this:
- Large high schools (grades 9–12) offer the best K-12 returns — bigger student populations and more flexible product rules than elementary or middle schools
- Community colleges hit a strong middle ground: solid revenue potential with far fewer exclusive national contracts than four-year universities
- Elementary and middle schools are rarely worth the compliance burden unless you're targeting staff break rooms specifically
What Most People Miss About School Vending Profitability
Three blind spots consistently trip up operators entering school vending:
1. Multiplying monthly revenue by 12
The most common forecasting error. A K-12 machine earning $300/month during active school months generates closer to $2,250–$2,500 annually once summer break (~2.5 months), winter break (~2 weeks), and spring break (~1 week) are factored out. Operators who model $3,600/year and plan purchases around that figure end up disappointed.
2. Underestimating Smart Snacks compliance work
New K-12 operators often don't anticipate the sourcing effort required for compliant products. Many standard distributor catalogs aren't organized by Smart Snacks eligibility, so operators need to verify each item against USDA calorie, fat, sodium, and sugar thresholds before stocking.
The USDA offers a Smart Snacks Product Calculator, but vetting a full planogram still takes real time — and compliant items aren't always available from the same wholesalers at the same price points as standard snack inventory.
Stocking non-compliant products in a K-12 machine during the school day is a contract risk: violations can lead to machine removal and immediate termination.
3. Using fixed restock schedules instead of data
School vending demand is irregular. The week before finals looks nothing like the week before winter break. Operators who show up on a fixed weekly schedule waste service trips during slow periods and miss stockouts during peak ones.
Real-time inventory alerts solve this directly. When your management software flags low stock as it happens, you service machines based on actual need rather than a fixed schedule. For a multi-school route, that shift cuts unnecessary trips and reduces fuel costs in a measurable way each month.
Frequently Asked Questions
How much does a vending machine make a month in a school?
A typical school vending machine grosses $150–$500/month depending on school type, enrollment size, and building placement. After product costs, commissions, and service, net profit is considerably lower — often $50–$150/month. K-12 machines also only operate during the roughly 180-day school year, so annualized figures need to reflect that.
How many vending machines do you need to make $1,000 a month?
At an estimated net profit of $50–$150/month per machine (depending on school type and contract terms), you'd need roughly 7–20 machines to hit $1,000/month net. College placements trend toward the higher end of that per-machine range; restricted K-12 placements toward the lower end.
What is the most profitable thing to sell in school vending machines?
In K-12 settings, Smart Snacks-compliant beverages — water, sports drinks, and lower-calorie juices — tend to perform best. In college settings, energy drinks and higher-margin snacks are unrestricted and typically drive the strongest per-transaction revenue.
Are vending machines allowed in K-12 schools?
Yes, generally. Vending machines are permitted in K-12 schools but must comply with USDA Smart Snacks in School standards for competitive foods sold to students during the school day. Individual districts may have additional restrictions beyond federal requirements.
Do schools get a percentage of vending machine sales?
It varies. Some schools negotiate a commission of 10–20% (or higher) of gross sales; others accept free placement as a student service. Public contract data shows commissions ranging from 5% to over 30% depending on school level and vendor terms.
Is a college or K-12 school better for vending machines?
Colleges generally produce higher, more consistent revenue due to fewer product restrictions, longer hours, and year-round foot traffic. K-12 schools have seasonal gaps and compliance requirements that compress margins. For most independent operators, large high schools and community colleges offer the best practical balance.