Key Takeaways
- Gross margin benchmark: Research confirms vending operators typically achieve 40–60% gross profit margins on product sales before operating expenses
- Net margin reality: After all costs, net margins typically fall between 20–30% for most well-run operations
- Monthly profit per machine: $40–$120/month at low-traffic sites; $300–$800/month at average locations; $1,000+/month at top performers
- Key profitability levers: Location quality, product mix, cashless payment acceptance, and remote monitoring technology
- Running 10+ machines boosts per-unit profitability through route efficiency and bulk purchasing power
Gross vs. Net: The Two Profit Margin Numbers That Matter
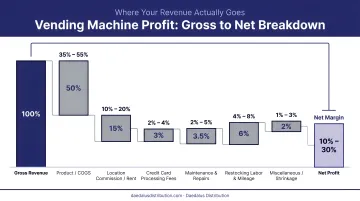
Most new vending operators focus on the wrong number. Gross profit margin measures the markup on products sold — revenue minus the cost of goods. Net profit margin reflects what you actually keep after every expense is paid: location commissions, fuel, maintenance, electricity, and payment processing fees. Many operators mistake gross for net and overestimate profitability by 20-30 percentage points.
Industry benchmarks confirm this gap. Research shows gross margins typically fall between 40-60%, with experienced operators targeting margins above 50%. Net margins land between 20-30% after all operating costs. That roughly 25-point difference is consumed by location commissions, processing fees, electricity, maintenance, and restocking labor.
A machine generating $1,500 in monthly revenue illustrates how fast gross margin shrinks. At a 50% gross margin, cost of goods is $750 — leaving $750 gross profit. Operating costs then take their share:
| Expense | Monthly Cost |
|---|---|
| Location commission (10%) | $150 |
| Electricity (refrigerated unit) | $50 |
| Payment processing fees | $40 |
| Fuel for restocking | $30 |
| Maintenance reserve | $30 |
| Total operating costs | $300 |
Net profit: ~$450/month — a 30% net margin. That's your actual take-home.
Why Gross Margin Alone Is Misleading
A 55% gross margin is meaningless if operating costs are out of control. A machine with high gross margin but a 25% location commission, frequent service calls, and spoiled inventory could easily net below 15%. Smart operators track both metrics: gross margin evaluates product pricing and buying power, while net margin evaluates real business performance.
What Operating Costs Cut Into Your Vending Profits
Understanding your cost structure is the only way to protect net margins. These are the expenses that separate gross from net:
Cost of Goods Sold (COGS): Your largest single expense. COGS typically represents 40-50% of revenue, meaning product costs consume roughly half of every dollar you collect. Buying in bulk or negotiating wholesale pricing reduces this percentage and improves gross margin directly.
Location Commissions: Property owners typically charge 5-25% of gross sales or a flat monthly fee. Always calculate expected net margin after commission before placing a machine — a high-volume location with a 25% commission can easily net less than a moderate-traffic free placement.
Keep commissions under 15% of gross sales when possible. Anything above 20% demands exceptional sales volume to justify.
Remaining Operating Costs:
- Electricity: $10-$50/month per machine, depending on refrigeration requirements
- Maintenance and repairs: $100-$300/year for routine service; $50-$200 per minor repair call
- Payment processing fees: approximately 2.5% per cashless transaction
- Fuel and labor: route costs for restocking visits (varies by distance and frequency)
- Insurance: general liability runs ~$37/month ($442/year); business owner policies average ~$58/month ($698/year) per industry data
- Business licenses: $50-$200 annually depending on state and local requirements
How Inventory Mismanagement Drains Net Margin
Expired products, overloaded machines, and slow-moving items steadily drain margins. Operators who don't track sell-through rates waste both product spend and service time restocking items that don't move.
This hits hardest with fresh, refrigerated, or short-shelf-life products. If you're visiting a location every week to pull expired salads nobody's buying, you're losing money on COGS, labor, and opportunity cost simultaneously.
Key Factors That Drive (or Drag Down) Your Vending Profit Margin
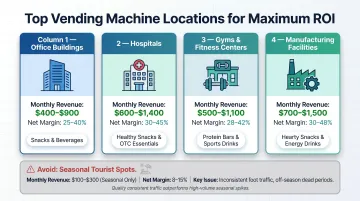
Location is the single most powerful variable. But not all traffic is equal. Differentiate between high foot traffic and high-quality traffic — consistent, repeat users who actually purchase. Offices, hospitals, gyms, and manufacturing facilities often outperform locations with higher but irregular traffic like seasonal tourist spots. Premium locations can generate up to $17,000/month, while poor placements struggle to break $75/month.
A "free placement" low-traffic location can absolutely outperform a commission-heavy high-traffic one on net margin. Run the math: A machine generating $800/month at 0% commission and 30% net margin yields $240. A machine generating $1,500/month at 20% commission and 25% net margin yields $281. The gap is smaller than you'd think, and the lower-traffic machine requires less frequent restocking.
Product mix and pricing strategy matter. Operators who tailor inventory to the specific demographic of a location achieve better sell-through and support higher price points. Health-focused products in a gym, energy drinks at a transit hub, fresh meals in a corporate office — matching product to context improves margins. Premium or niche products often command higher margins than standard snacks, even at lower volume.
Cashless payment technology is a margin-positive investment. 71% of all vending machine sales in 2024 were cashless, with the average cashless transaction ($2.24) outpacing cash transactions ($1.78) by 25.8%. While card processing fees apply (roughly 2.5% per transaction), the net effect is positive: customers spend more per visit, and friction-to-purchase is eliminated.
Modern consumers expect tap-to-pay and mobile wallet options — machines without cashless capability are missing out on a growing share of transactions.
Machine type and features influence margins long-term. Newer machines with touchscreen interfaces, remote monitoring, and real-time sales data allow operators to catch underperformance early, reduce unnecessary service trips, and make data-driven restocking decisions.
Vendekin machines — distributed in the U.S. by Daedalus Distribution — include built-in remote inventory tracking and sales reporting, giving operators the visibility to stay leaner and more profitable from day one. Older cash-only machines lack this intelligence, forcing operators to guess when restocking is needed and which products are actually moving.
Profit Margins by Vending Machine Type
Not all machines deliver the same margins. Here's how common categories compare:
| Machine Type | Gross Margin | Notes |
|---|---|---|
| Phone charger/tech accessories | 80-90%+ | Highest margin; "emergency" need pricing supports premium rates |
| Specialty coffee/beverage | 70-85% | Cost per cup $0.50-$1.00 vs. $4-$6 retail; requires quality equipment |
| Fresh food/meal kits | 60-75% | Higher spoilage risk; requires refrigeration and tighter inventory control |
| Ice cream/frozen novelty | 60-70% | Specialized equipment and freezer maintenance |
| Healthy vending (salads, yogurt) | 50-65% | Higher spoilage risk; best in dedicated wellness environments |
| Standard snack/combo | 40-60% | Baseline category; predictable sales but limited pricing flexibility |
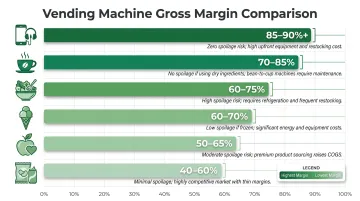
Source: VendingCore and Pyramid Technologies industry analysis.
Specialty machines offer higher gross margins but come with higher equipment costs — typically $6,000-$15,000 versus $3,000-$6,000 for standard snack units — plus greater operational demands around restocking, spoilage, and maintenance. A high-margin machine only outperforms if the location generates consistent demand and you have the capacity to service it properly.
How Many Machines Do You Need to Hit Your Income Goals?
A single machine generates modest income. Realistic monthly net profit ranges:
- Low performers (poor location, new operator): $40-$120/month
- Average machines (decent location, experienced operator): $300-$800/month
- High performers (premium location, optimized operations): $1,000-$1,600/month
To reach $100,000/year in net profit:
- At $300-$500/month per machine (ordinary locations): 17-28 machines needed
- At $700-$800/month per machine (good locations): 11-12 machines needed
Source: WiderMatrix and Haloo Vending operator estimates.
Per-machine profit improves meaningfully as you scale. Operators running 10+ machines can:
- Buy inventory at wholesale pricing rather than retail (lower COGS)
- Cluster restocking into efficient routes (fewer trips per machine)
- Negotiate from a stronger position with property owners
A single-machine operation pays retail and makes one-off restocking trips. A 25-machine operation does the same work more efficiently, improving per-machine net margins by 5-10%.
Realistic timeline: A single machine typically takes 6-18 months to recover its purchase and setup costs, depending on machine cost ($1,500-$15,000) and location performance. Scaling profitably requires reinvesting early profits into additional well-placed machines rather than treating the first machine as immediate income.
How to Maximize Your Vending Machine Profit Margins
Three operational changes deliver the highest margin impact:
Conduct regular product performance reviews — Remove slow sellers every 30-60 days based on sales data, not guesswork. Replace underperformers with items that match location demographics.
Renegotiate or exit high-commission location agreements — If a location's commission exceeds 15% and sales don't justify it, renegotiate terms or relocate the machine. A mediocre free location often nets more than a high-traffic commissioned one.
Invest in cashless payment capability — If your machines don't accept cards and mobile payments, you're losing 25%+ in transaction value and alienating modern consumers. Cashless integration drives 25%+ revenue increases while processing fees cost only 2.5%.
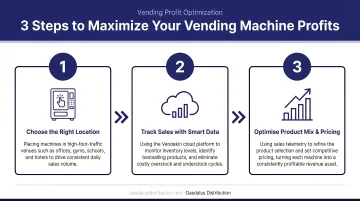
Remote monitoring is where operational savings compound fastest. Operators who track sales, inventory levels, and machine performance remotely eliminate unnecessary service trips, catch issues before they cause downtime, and make restocking decisions based on actual data. Smart scheduling via telemetry reduces operational expenses by 25%, while real-time pre-kitting cuts another 15%.
Machines with built-in cloud management — like those from Vendekin, available through Daedalus Distribution — include remote inventory tracking and sales reporting with no additional software fees. That means immediate visibility into what's selling and what's sitting, without extra monthly costs eating into your margins.
Route efficiency is another area operators often underestimate. Labor and fuel costs grow fast as your operation scales. Optimizing your routes based on real-time inventory data — rather than a fixed service schedule — pays off in three concrete ways:
- Fewer unnecessary trips to machines that don't yet need restocking
- Lower fuel costs per machine serviced
- More time to focus on higher-need locations and new placements
Frequently Asked Questions
What is a good profit margin for a vending machine?
A good gross margin is 50-60%, but net margin matters more. Well-run operations achieve 25-30% net margins after all expenses. "Good" depends on location quality and cost control — operators in strong locations with low commissions and smart technology can exceed 30% net.
How much money do vending machines make monthly?
Monthly revenue ranges from $300-$1,500 per machine on average, with net profit between $40-$120 for underperformers and $300-$800 for well-placed machines. Premium locations can generate $1,000+ in monthly net profit. Location quality and product mix determine where your machine lands in that range.
What is the average profit of a snack vending machine?
Standard snack machines achieve 40-60% gross margins and 20-25% net margins after operating costs. These machines offer predictable sales but limited pricing flexibility compared to premium or specialty product machines like coffee or fresh food.
How many vending machines do you need to make $100k?
At $700-$800/month net profit per machine (realistic for good locations), you'd need approximately 11-12 machines to reach $100,000 annually. This number decreases as operators scale and improve per-machine efficiency through better routes, bulk buying, and data tracking.
How long does a vending machine take to pay for itself?
Payback periods range from 6-18 months depending on machine cost ($1,500-$15,000) and monthly net profit. A $5,000 machine generating $400/month net profit pays for itself in approximately 12-13 months. Machines placed in high-traffic locations with consistent restocking schedules tend to hit that threshold faster.
Are vending machines a good investment in 2026?
Yes, when approached with realistic expectations and the right equipment. The vending industry continues to grow, with consumer spending at food and beverage vending machines exceeding $3.5 billion in 2024, up 15% year-over-year. Machines that accept card and mobile payments — and offer remote sales tracking — consistently outperform cash-only models in both revenue and uptime.