Introduction
Most vending operators place machines reactively—wherever they can secure access—rather than proactively, based on data-backed performance indicators. This approach leaves significant revenue on the table. Profitable operations are built on deliberate placement, product selection, and route design—not machine quality alone.
The U.S. vending industry generates $18.2 billion annually across 2.89 million machines, averaging $6,284 per machine per year—roughly $524 per month. Yet performance varies wildly: high-performing locations can generate three times that average, while poor placements drain time and fuel without proportional returns. The gap between the two comes down to strategy.
This guide covers distribution strategy frameworks, location selection criteria, route planning, product-location matching, and the technology infrastructure that makes scaling possible. Whether you're placing your first machine or managing a growing fleet, treating vending as a structured distribution channel is what gets you to the next level.
Key Takeaways
- Vending distribution is about deliberately choosing placement, products, and routes to maximize revenue per stop
- High-performing locations share three traits: sustained foot traffic, captive or time-limited audiences, and demographic alignment with your product mix
- Route density matters as much as individual location quality—profitability per stop depends on keeping travel time between machines under 20 minutes
- Smart technology—remote tracking, cashless payments, sales dashboards—removes the ceiling that stops most operators from scaling past 15 machines
What Is Vending Machine Distribution and Why Strategy Matters
Vending machine distribution is the deliberate process of deciding where machines are placed, what products they carry, and how they are serviced—treated as a true distribution network rather than a collection of independent placements. Every placement decision in a well-run operation is informed by traffic data, demographic fit, and route efficiency—not just available floor space.
Operators who place machines based solely on access—wherever they can get permission—tend to accumulate underperforming locations that drain service time without generating proportional revenue. With the U.S. average sitting at $524 per machine per month, a single underperforming location generating $150/month still requires the same restocking trips, fuel costs, and inventory management as a $600/month location. Over a 10-machine route, those inefficiencies compound quickly.
Why Distribution Strategy Is a Competitive Advantage
Operators who apply structured frameworks consistently outperform those who don't—regardless of machine quality. The gap shows up in three measurable areas:
- Targets locations with predictable demand patterns and captive audiences, driving higher average revenue per stop
- Clusters placements geographically to cut drive time, enabling more stops per service day without adding labor
- Matches inventory to location demographics, reducing waste and increasing product turns—improving margins even when gross sales hold flat
Manufacturing facilities alone account for 35.83% of U.S. retail vending revenue, not because factories have more foot traffic than malls, but because they have captive shift workers with predictable break schedules and limited alternatives. Location selection with those conditions in mind is exactly what separates operators who scale from those who stall.
The Four Vending Distribution Strategies (and When to Use Each)
The four classic distribution strategies—intensive, selective, exclusive, and direct—apply to vending just as they do to traditional retail channels. The key is choosing the right model for your growth stage, resources, and target market. Most successful operators don't pick one exclusively; they blend strategies across their portfolio based on location type and capacity.
Intensive Distribution
Intensive distribution in vending means placing machines in as many viable locations as possible within a defined geography to maximize product visibility and capture volume. This works best for high-volume, low-margin consumables like beverages and snacks in densely populated markets where brand recognition and convenience drive repeat purchases.
The trade-off: intensive strategies require reliable route infrastructure. You'll need more machines, tighter restocking schedules, and strong operational efficiency to manage the increased service load. This approach scales profitably only when route density is high enough to keep travel time between stops minimal—ideally 10 to 20 minutes per stop.
Best for: Operators with access to capital, established supply chains, and a goal of market saturation in urban or campus environments.
Selective Distribution
Selective distribution means choosing only locations that meet defined performance thresholds before committing a machine. This is the most common strategy for growing operators who want to scale sustainably without overextending resources.
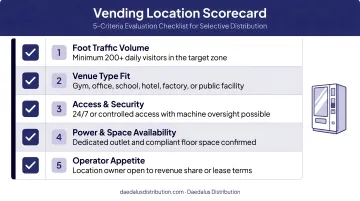
How to build a location scorecard:
Evaluate each potential site against criteria such as:
- Minimum daily foot traffic: Set a floor (e.g., 200+ visitors per day) to ensure baseline demand
- Competitor presence: Existing vending machines aren't always a red flag—they can validate demand—but oversaturation is a risk
- Facility operating hours: Longer hours (especially 24/7) increase sales windows
- Audience type: Does the demographic align with your product mix? (e.g., fitness centers for protein bars, factories for energy drinks)
- Power and placement accessibility: Proximity to outlets, visibility in high-traffic pathways, ADA compliance
Score each location numerically and set a minimum threshold before signing agreements. This keeps underperforming placements out of your route from the start.
Exclusive Distribution
Exclusive distribution in vending involves securing an exclusive contract with a single high-volume location—such as a large hospital system, manufacturing campus, or university—in exchange for premium placement and service guarantees. The location agrees not to allow competing vending operators in return for consistent machine uptime, product variety, and often a higher revenue share.
Revenue-sharing agreements:
Exclusive arrangements typically involve commissions ranging from 5% to 25% of gross sales, depending on location type and negotiation leverage:
- Office buildings: 10%–20%
- Schools and universities: 15%–30%
- Hospitals: 10%–20%
- Retail/malls: 20%–30%
Higher commissions are justified when the location delivers guaranteed high volume or provides exclusive access to a captive audience. Structure these deals with clear service-level expectations (restocking frequency, product variety, machine uptime) to protect both parties.
Direct Distribution
Direct vending distribution means the operator sells products straight to the end consumer with no intermediary retail channel. That's vending's core structural advantage: 24/7 automated sales with zero staffing cost at the point of sale.
Unlike traditional retail—where product moves through wholesalers, distributors, and shelf space negotiations—vending operators control the entire chain from procurement to final sale. This eliminates markup layers and puts pricing, product selection, and margin management entirely in the operator's hands.
The machine itself is the only "employee" at the point of sale, running around the clock without wages, benefits, or scheduling constraints. That operational reality is why this model works where traditional retail doesn't—factory floors, apartment laundries, hospital waiting rooms—and why vending remains an $18.2 billion annual industry despite the rise of delivery apps and mobile ordering.
How to Identify and Secure the Right Vending Locations
Every location evaluation must start with two foundational criteria: (1) sustained, measurable foot traffic and (2) a demographic profile that aligns with your product mix. A busy location with the wrong audience—such as a luxury spa running a chips-and-soda machine—underperforms just as badly as a low-traffic one. Both factors must align.
Highest-Performing Location Categories
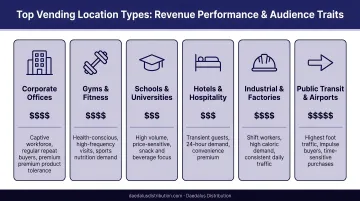
Different environments generate different revenue profiles. Here's what makes each work:
| Location Type | Why It Works | Revenue Note |
|---|---|---|
| Manufacturing & distribution | Multi-shift workforce, no nearby food, predictable break schedules | 35.83% of U.S. vending revenue comes from these facilities |
| Hospitals & care facilities | 24/7 demand from staff, visitors, and families during extended, unplanned stays | Outperform airport locations on revenue per machine |
| Schools & universities | Daily habitual buyers; students and staff return to the same machines | Revenue share runs 15%–30%, but consistent volume compensates |
| Offices with 100+ employees | Steady demand during work hours, especially with limited nearby retail | Offices under 50 employees rarely justify regular service runs |
| Apartment complexes | Captive residential audience; laundry rooms, gyms, and lobbies create passive recurring sales | No competing retail in most multi-unit buildings |
The Captive Audience Principle
Locations where people cannot easily leave to buy food elsewhere generate more reliable vending revenue than pass-through locations. Restricted-exit locations such as manufacturing break rooms and hospitals consistently outperform open-access, transient locations like malls or transit hubs.
Examples of captive environments:
- Factories (workers can't leave mid-shift)
- Hospitals (visitors and staff during long shifts)
- Gyms mid-workout (members don't want to leave and return)
- Laundromats (customers wait for cycles to finish)
- Car dealership service waiting areas (customers waiting for repairs)
The common thread: people are stuck there by circumstance, and vending provides the most convenient—often only—option.
Location Scouting and Permission Process
Approaching property managers or facility directors requires a clear value proposition:
- What you offer: Clean, modern machines with regular restocking and maintenance at no cost to them
- Revenue share: Propose a commission structure (typically 10%–20% for offices and hospitals, higher for schools or retail spaces)
- Low-friction agreements: No-contract or short-term trial arrangements reduce resistance. Offer a 90-day pilot with an option to extend if performance meets expectations
Lead with the benefit to them: additional amenity for employees/residents, passive income stream, zero operational burden.
Physical Site Evaluation
When evaluating a site in person, check for:
- Proximity to power outlets: Machines need accessible 110V outlets; extension cords across walkways are safety hazards
- Visibility and foot traffic flow: Is the machine on the natural path people take, or hidden off to the side? High-visibility placements near entrances, break rooms, or elevator lobbies perform best
- Signage potential: Can customers see the machine from a distance, or do they have to stumble upon it?
- ADA accessibility: Ensure wheelchair users can access the machine and payment interface comfortably
These details matter. A machine placed five feet off the main corridor can see 30%–40% lower sales than one in the direct traffic path. Get the location right first — everything else in your vending operation builds on that foundation.
Route Planning and Territory Management
Route design matters as much as individual location quality. A collection of profitable locations spread too far apart can become unprofitable once service time and fuel costs are factored in. The concept of route density—maximizing the number of stops within a defined geography—directly impacts net profitability per service day.
Building a Territory with Route Density in Mind
Start with 2-3 high-volume anchor locations in a target area, then fill in surrounding stops to build density. This approach minimizes drive time and maximizes stops per route hour.
Practical territory-building steps:
- Secure 2-3 high-performing anchor sites—hospitals, large offices, manufacturing facilities—that justify the initial route investment
- Define a 10–15 mile service radius around your anchors and identify secondary locations within that zone
- Fill in lower-volume placements—apartment complexes, gyms, small offices—as long as they don't add more than 10 to 20 minutes of travel time between stops
- Set a revenue-per-stop threshold: don't add a location unless it meets a minimum monthly revenue target (e.g., $300/month gross) to cover incremental service costs
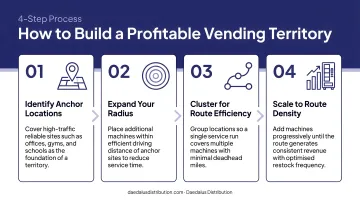
The goal: maximize stops per hour serviced, not just total machines deployed.
Once your territory is mapped, restocking frequency becomes the next lever for route efficiency.
Planning Restocking Frequency
Not every machine needs weekly service. Use sales velocity data to determine which machines need frequent visits (high-volume locations) and which can run on a longer cycle—reducing unnecessary service trips.
Frequency tiers:
- High-volume locations (manufacturing, hospitals): Weekly or twice-weekly restocking
- Moderate-volume locations (offices, schools): Every 10–14 days
- Low-volume locations (apartment complexes, gyms): Every 2–3 weeks
Demand-based restocking through telemetry ensures machines are only serviced when inventory drops below a set threshold—cutting wasted trips and tightening route efficiency.
Expanding into New Territories
Signs that a current territory is saturated:
- All viable locations within your service radius are covered
- Adding new stops increases travel time beyond 20 minutes between machines
- Diminishing returns on new placements (locations generate less than $250/month)
How to replicate a successful route model:
- Choose an adjacent geography with similar demographics and location types
- Start with 2-3 anchor locations again, then build density
- Avoid leapfrogging into distant markets—scattered placements destroy route efficiency
The operators who scale successfully treat expansion as a system, not a series of opportunistic placements. Replicate what works geographically, one dense territory at a time.
Product Selection: Matching Your Inventory to Your Locations
The best-performing vending machines are stocked based on the specific demographics and behavioral context of each location, not a one-size-fits-all product list. A gym machine and a hospital machine should look fundamentally different inside.
Top-Performing Vending Product Categories by Location Type
U.S. vending product category distribution (2024):
- Confections: 25%
- Cold beverages: 17.6%
- Healthy options: 16.6%
- Snacks: 12%
- Food: 8.7%
- Candy: 8.3%
These are industry averages. What actually moves the needle is tailoring that mix to each specific location — here's how top operators break it down:
Gyms and fitness centers:
- Protein bars/shakes: 40%
- Sports drinks: 30%
- Healthy snacks: 20%
- Water: 10%
Hospitals and care facilities:
- Grab-and-go meals: 30%
- Beverages (water, coffee, juice): 35%
- Comfort snacks (chips, cookies): 25%
- Personal care items: 10%
Offices and corporate buildings:
- Healthy snacks: 35%
- Beverages (coffee, energy drinks, water): 40%
- Traditional snacks: 25%
Manufacturing and factories:
- Energy drinks: 25%
- Salty snacks: 30%
- Beverages (soda, water): 25%
- Meal replacement bars: 20%
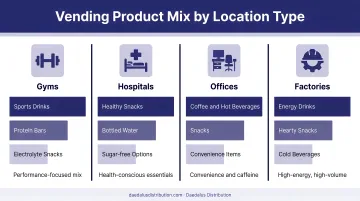
The takeaway is straightforward: match the product to the context. Gym-goers want protein; factory workers on night shifts want caffeine and quick calories. Getting that right at the placement stage is the foundation — the next step is keeping it optimized over time.
Product Rotation and Seasonal Adjustment
Stocking machines with the same products indefinitely leads to buyer fatigue. 42% of operators refresh their product mix monthly, and 28% do so quarterly.
How to use sales data for product rotation:
- Flag any SKU selling fewer than 3 units per week (in a moderate-volume location) as a candidate for removal
- Replace one slow mover at a time rather than overhauling the entire planogram — this keeps your data clean
- Give new products 2-3 weeks to establish a baseline before making a final call
- Adjust for seasons: cold beverages and hydration products peak in summer; comfort snacks and hot beverages pick up in winter
Rotation isn't about constant change. It's about cutting what's not selling and giving customers a reason to come back.
Using Technology to Scale Your Vending Distribution
Scaling a vending route beyond 10-15 machines without technology becomes unmanageable. Operators who rely on manual inventory checks and cash reconciliation hit a ceiling on how many locations they can manage profitably. Technology removes that ceiling.
Key Technology Capabilities for Distribution Operators
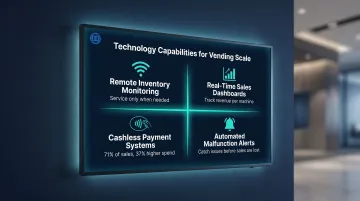
Four capabilities make the biggest operational difference at scale:
- Remote inventory monitoring: Telemetry-driven restocking tells you which machines need a visit before you leave the warehouse — cutting unnecessary trips and preventing stockouts at high-volume stops.
- Real-time sales dashboards: Track revenue per machine, sales by time of day, and top-performing SKUs to sharpen both product mix and placement decisions.
- Cashless payment systems: Cashless transactions now account for 71% of vending sales, with cashless users spending 37% more per visit ($2.24 vs. $1.78). Machines without it are leaving money behind.
- Automated malfunction alerts: Get notified the moment a machine goes offline, throws a payment error, or shows an inventory discrepancy — before lost sales pile up unnoticed.
Case Study: Technology-Driven Route Growth
One vending operator implementing a vending management system (VMS) with dynamic routing reduced machine service visits by 15% and increased collections per service by 9%. Another operator reduced active routes from five down to three while maintaining the same number of machines—purely through better route planning and telemetry.
These aren't marginal gains. They're the difference between managing 15 machines manually and scaling to 40+ machines profitably.
Daedalus Distribution's Vendekin Machines: Built-In Route Management
Daedalus Distribution's Vendekin machines (Omnivend Combo 22, Omnivend Combo 10, Elevend Multivend 22) come equipped with built-in remote inventory tracking and sales data reporting through Vendekin's cloud-based management platform. Operators get real-time visibility into stock levels, revenue by machine, and restocking needs—without manual audits at every stop.
This is particularly valuable as operators move from a handful of machines to a full multi-location network. The software eliminates the operational ceiling that stops most vending businesses from scaling beyond 15-20 machines, so operators can expand routes without adding proportional service time.
Frequently Asked Questions
What are the 5 channels of distribution?
The five channels are direct, retail, wholesale, distributor, and agent/broker. Vending machines operate as a form of direct automated retail—cutting out intermediaries between the product and the end consumer, which is why operators control pricing and margins directly.
What are the four types of distribution strategies?
Intensive (maximum coverage), selective (curated high-performing locations), exclusive (single-location contracts), and direct (selling straight to the consumer). Vending operators typically blend selective and direct distribution to balance growth and operational efficiency.
What sells most in vending machines?
Beverages (water, energy drinks, sodas) and salty snacks consistently rank as top sellers, while healthy options and protein bars are the fastest-growing category. Top sellers vary by location type—gyms favor protein products, while factories favor energy drinks and quick snacks.
How many vending machines do you need to make a full-time income?
A typical machine generates $150 to $400 in monthly gross revenue. To replace a $100,000 annual income, most operators need 25 to 40 machines, assuming a 20%-25% net profit margin after product costs, commissions, fuel, and maintenance.
Do I need a contract to place a vending machine at a business?
Formal agreements are strongly recommended. Contracts should cover commission/revenue share (usually 10%-20%), machine placement, restocking responsibility, and termination terms. Document everything in writing, even for informal arrangements.
How do I expand my vending route without losing efficiency?
Focus on geographic density—expand into adjacent territories, not scattered locations. Use sales data to prioritize high-volume sites and use remote monitoring technology to manage more stops without adding proportional service time. Keep travel time between machines under 20 minutes and set minimum revenue thresholds for new placements.